The COVID-19 survey collected and analysed more than 11 million swab tests and 3 million blood tests from households, and in line with the changing path of the pandemic, the UK Health Security Agency (UKHSA) are currently reviewing their approach to COVID-19 surveillance to ensure it is proportionate and considered alongside other respiratory illnesses.
With the survey data collection pausing whilst these discussions take place, we wanted to take the time to reflect on our digital approach and share some of the insights.
Government needs to be able to respond quickly
Understanding more about the rate of COVID-19 infection in the general population, and the longer-term prevalence of antibodies, was a vital part of the Government response to the virus and to minimise the burden on NHS resources and personnel, tests were undertaken by nurses from the data science company IQVIA UK in participants’ own homes. By mobilising a dedicated nationwide team of IQVIA nurses to undertake the COVID-19 tests in the community, frontline NHS staff continued to focus on providing care for those who need it.
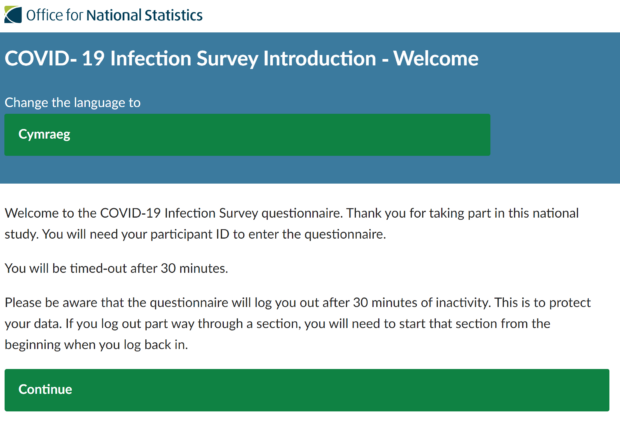
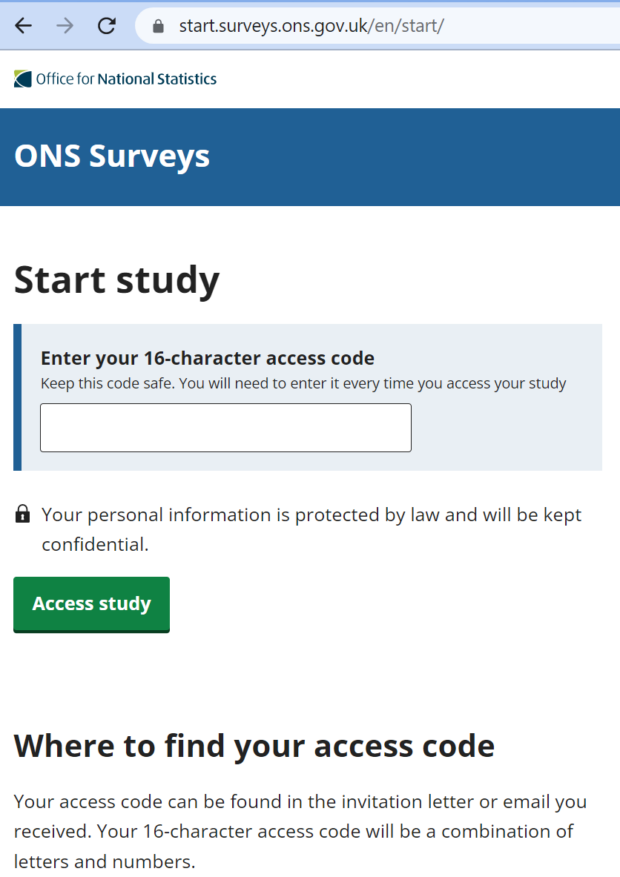
To provide a more flexible approach for participants and to help reduce costs to the taxpayer and the carbon footprint, we introduced a digital questionnaire in July 2022 and partnered with IQVIA again to deliver it as the ONS owned platforms on which we run our surveys, wouldn’t have been ready in time.
To expedite the delivery of the digital questionnaire, we took the decision use a proprietary platform and the successful beta service assessment acknowledged that “the service had to be quickly turned around with limited resources and the team has done a good job with producing a service that solves most of the challenges.”
As with most beta service assessments there are recommendations, and our quick response and turnaround largely reflected the comments. Being able to deliver the digital service quickly and successfully whilst acknowledging the things that can improved given more time, is a careful balance but one we managed to achieve.
People will only choose to use government services digitally if they are more straightforward and convenient
At the outset of the survey, field workers would visit homes to gather the samples and then send them on for analysis and there were nearly 5 million unique home visits conducted across the nations. The digital questionnaire allowed participants to package their swab and blood kit samples and to take them to their nearest post box. To ensure the data continued to be representative, other options were available for those who were unable to take part online or by post.
The data was recognised as “critical surveillance” in line with the UK government’s Living with COVID plan and so moving to the more flexible approach and reducing the burden on participants further helped to provide vital weekly data on virus positivity levels across the UK, details on new variants, the characteristics of those who had the virus and their antibody levels and details of long COVID prevalence.
Defining what good looks like and identifying appropriate metrics is an important part of the government service standard as it indicates how well the service is solving the problem it’s meant to solve. Some of the metrics captured that we think showed the successful move of the survey to digital include:
- 85% of our participants were retained during the transition from field service to the digital model with most participants enrolling within 4 days of their invite
- 95 million surveys were completed using the digital questionnaire
- 94% of participants chose to use the on-line service
- 90% response rate from over 2.3 million opportunities for participants to submit a survey
To provide some context for the above metrics, the 2020 statistical release of internet use in the UK showed that 92% of adults were recent internet users and Census 2021 showed that nearly 90% of households in England and Wales responded on-line. Additionally, Census 2021 showed that 97% of households took part)
Effective contract management is essential to drive value for money and deliver successful outcomes
Ensuring all stakeholders were working from the same information and towards the same outcome was most important. Communication is at the heart of any successful project and programme, and this was especially the case for the digital elements of the survey where technical, legal, commercial, and statistical language all combined, and so getting this right enabled us to make good decisions.
Collaboration, openness, transparency and flexibility was also important, and we found the following to be particularly helpful in delivering and incentivising the desired behaviours and outcomes:
- involving DDaT people in contract and supplier management
- ensuring transparency of team utilisation and reviewing burn downs
- communicating the implications of decisions and actions
- formally assuring the deliverables
- allocating risks appropriately and monitoring them diligently
- aligning the pricing and payment mechanism with the delivery approach
Open, interoperable, and visible data is a must
The ability to exchange and share information and data between the ONS, IQVIA, UKHSA and the University of Oxford whilst protecting users’ privacy, was essential to the success of the survey as it empowered others to make timely and informed analysis and decisions for the public good.
Data was shared securely using consistent methods and data standards, enabling us to collect, ingest and analyse large amounts of data and publish statistical releases weekly. (IQVIA were securely transferring around 725,000 rows of participant response data daily to the ONS.)
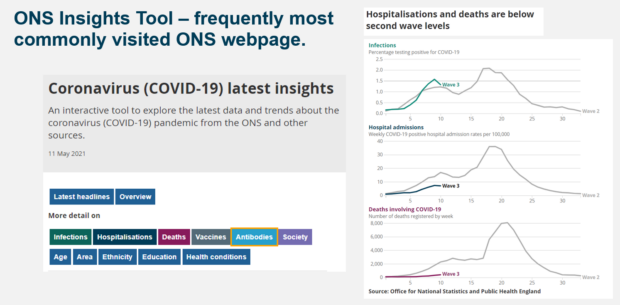
In December 2020 ONS launched a new interactive tool to allow people to access a range of COVID-19 data, graphs and data visualisations in one place and it frequently became the most visited ONS webpage. It gave people an easy way to navigate all of the data and more - important visualisations and narrative on the level of the virus in the community, the number of deaths involving the virus, and its impact on individuals and society. Allowing users to drill down to get more information on a chosen theme or topic - for example looking at the percentage of people testing positive for COVID-19 by region, the number of deaths involving the coronavirus by age group, or preventative measures in different areas of England.
New ways of presenting data were also developed to communicate complex models, including interactive charts that showed progression over time to be displayed (some of these charts were used in televised briefings on national television).
Users expect to be able to use online services 24 hours a day, 365 days a year
Many users have limited choice over how and when they access government services. For example, they may be a carer who only has time to complete a survey in the early hours of the morning. If a survey is unavailable or slow, it can mean those users won’t be able to submit their survey and the statistics we produce won’t be truly representative. It was essential that the digital questionnaire maximised the uptime and speed of response, could be deployed regularly when changes were introduced, and had appropriate monitoring in place. Making the survey available for 24 hours a day, 7 days a week helped to get the 90% response.
Some of the notable metrics we captured from August 2022 were:
- 99.8% availability
- 34 software releases
- 8000 average daily logins (peaking at 20,000 logins on 12th September 2022)
- 14.5% of questionnaires were completed between 8pm and 8am
- 11 minutes average questionnaire completion time
What’s next?
Recognising that we need to respond to any future surveillance or survey data collection that may be required at short notice, we’ve been further developing our ONS platforms to be able to quickly meet the needs and expectations of our users. The platform we use for business surveys has been enhanced to collect health and population data and we’ve been
- incorporating the recommendations from the beta service assessment
- updating our ONS Design System with components specific to health surveys
- developing “questionnaire window” functionality to allow surveys to be sent to a subset of participants at regular intervals
- embedding our standard design patterns and components into the new COVID-19 and Respiratory Infections Survey (CRIS).
The CRIS survey aims to understand and manage COVID-19 and other respiratory infections in the long term and is mainly online. Swabs and blood samples aren’t being collected and telephone appointments are available for help to complete it if required.
We sent invitations to a subset of the COVID infection survey respondents in early April and we’re getting ready to send the survey to more respondents in the coming weeks and months. The data from the study are important in helping us understand the impact of COVID-19, long COVID and other respiratory infections on the lives of individuals, the community and on health services and how they are changing.
If you're interested in a digital, data and technology career with us that helps to deliver statistics for the public good, have a look at our current career opportunities on Civil Service jobs.
1 comment
Comment by Kirsty Rhodes posted on
Great work team!